London postcode waste differences are not accidental. They reflect how people live, build, shop, and dispose of materials across the capital. Some areas generate significantly more waste than others, and understanding why helps councils, residents, and businesses manage rubbish more effectively.

London produces millions of tonnes of waste each year, yet the volume varies sharply between postcodes. These contrasts reveal deeper patterns in housing density, population behaviour, and commercial activity. Exploring London postcode waste differences allows us to identify where improvements are most needed and which solutions actually work pasted.
Key Takeaways
- London postcode waste differences are driven by local living patterns
- Housing type strongly influences waste volume
- Commercial zones generate disproportionately high waste
- Recycling performance varies widely by postcode
- Infrastructure gaps worsen waste outcomes in dense areas
Understanding London’s Waste Landscape
London’s waste system mirrors the complexity of the city itself. While boroughs operate under shared national rules, postcode-level realities often determine how much waste is produced and how effectively it is managed.
Population density, property size, and local services all shape London postcode waste differences, making one-size-fits-all policies ineffective.
The Current State of Waste Management
London processes more than 18 million tonnes of waste annually. This includes household rubbish, commercial waste, and construction materials. While household waste often receives the most attention, it represents only a portion of the total.
| Waste Source | Approx. Tonnes (Millions) | Share of Total |
|---|---|---|
| Construction & demolition | 9.7 | 54% |
| Commercial & industrial | 5.0 | 28% |
| Household | 3.1 | 18% |
Construction alone accounts for more than half of all waste produced in the city. Areas undergoing rapid redevelopment naturally show higher waste figures.
Recycling and Landfill Realities
Despite long-standing sustainability goals, London’s recycling rate remains around 30–33%, well below the UK average of approximately 43%. Around 750,000 tonnes of waste still end up in landfill every year. These figures highlight why improving recycling performance remains a priority across many postcodes.
Waste Generation by Postcode in London
The quantity of rubbish collected each week can vary significantly between neighbouring areas. These differences are driven by a mix of demographic, economic, and infrastructural factors.
Demographic and Housing Influences
Population density plays a major role. Postcodes dominated by large blocks of flats often generate high volumes of waste per building, even if individual households produce less. Limited storage space makes separating recyclables more difficult, especially in older properties.
Household composition also matters. Larger families tend to generate more waste, while single-occupant flats often produce smaller volumes but may recycle less consistently.
Income levels can influence consumption patterns. Some higher-income areas generate more packaging waste due to online shopping and takeaway culture, while lower-income areas may struggle with recycling access and education.
Recycling Performance by Borough
Recycling rates vary widely across London, reflecting both infrastructure and engagement levels.
| Borough | Recycling Rate | National Context |
|---|---|---|
| Newham | ~14% | Lowest in England |
| Westminster | ~17% | Among the lowest |
| Lewisham | ~18% | Below average |
| Wandsworth | ~22% | Below average |
| Hammersmith & Fulham | ~23% | Below average |
Such disparities show why postcode-level analysis is essential when addressing waste challenges.
The Impact on Local Infrastructure
High-waste postcodes place greater strain on local services. Councils must schedule more frequent collections, invest in larger bins, and expand processing capacity. As London’s population continues to grow, total waste is expected to increase by around one million tonnes per year, putting even more pressure on existing infrastructure.
Without targeted intervention, the gap between high- and low-performing postcodes is likely to widen.
How Housing Shapes London Postcode Waste Differences
High-density postcodes dominated by flats tend to produce higher waste volumes per building. Limited internal storage makes sorting recyclables difficult, pushing residents toward general waste disposal.
By contrast, areas with larger houses and outdoor space often show better recycling habits. Storage capacity directly affects how residents separate materials, reinforcing postcode-level differences in waste outcomes.
From Landfill to Energy Recovery
Rising landfill taxes and environmental concerns encouraged a shift toward incineration with energy recovery. The closure of major landfill sites marked a turning point, pushing councils to adopt alternative solutions.
Policy Changes and Public Awareness
Stricter regulations and growing environmental awareness have reshaped attitudes toward waste. However, not all postcodes have adapted at the same pace. Some areas benefited from early investment in recycling infrastructure, while others continue to lag behind.
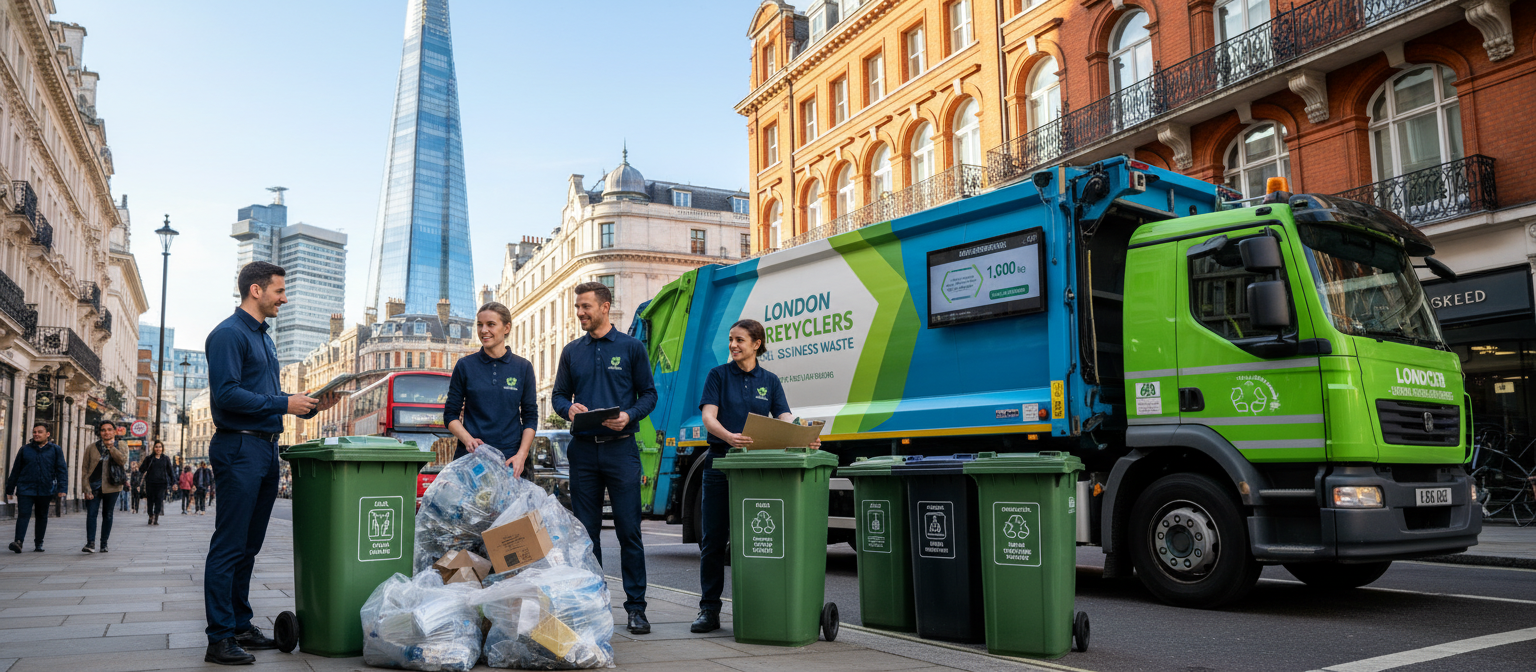
The Role of Businesses and Commercial Waste
Commercial activity significantly affects local waste volumes. Offices, restaurants, and retail outlets generate large amounts of packaging, food waste, and disposable materials.
Trade Waste at a Glance
Businesses account for roughly one-third of London’s total waste, producing around five million tonnes annually. Postcodes with dense commercial activity, especially in central areas, naturally report higher waste levels.
Corporate Responsibility and Sustainability
Many organisations now adopt waste reduction strategies, such as improved recycling systems and sustainable procurement policies. Initiatives promoted by organisations like WRAP (https://wrap.org.uk) help businesses cut waste and reduce environmental impact.
The Fatberg Problem and Everyday Habits
Few examples illustrate postcode-specific waste issues better than London’s infamous fatbergs. These massive sewer blockages form when fats, oils, wet wipes, and hygiene products are disposed of incorrectly.
The 2017 Whitechapel fatberg demonstrated how individual behaviour can create serious infrastructure problems. Areas with many food outlets face higher risks, reinforcing the need for better waste education and enforcement.
Sustainable Waste Initiatives Across London
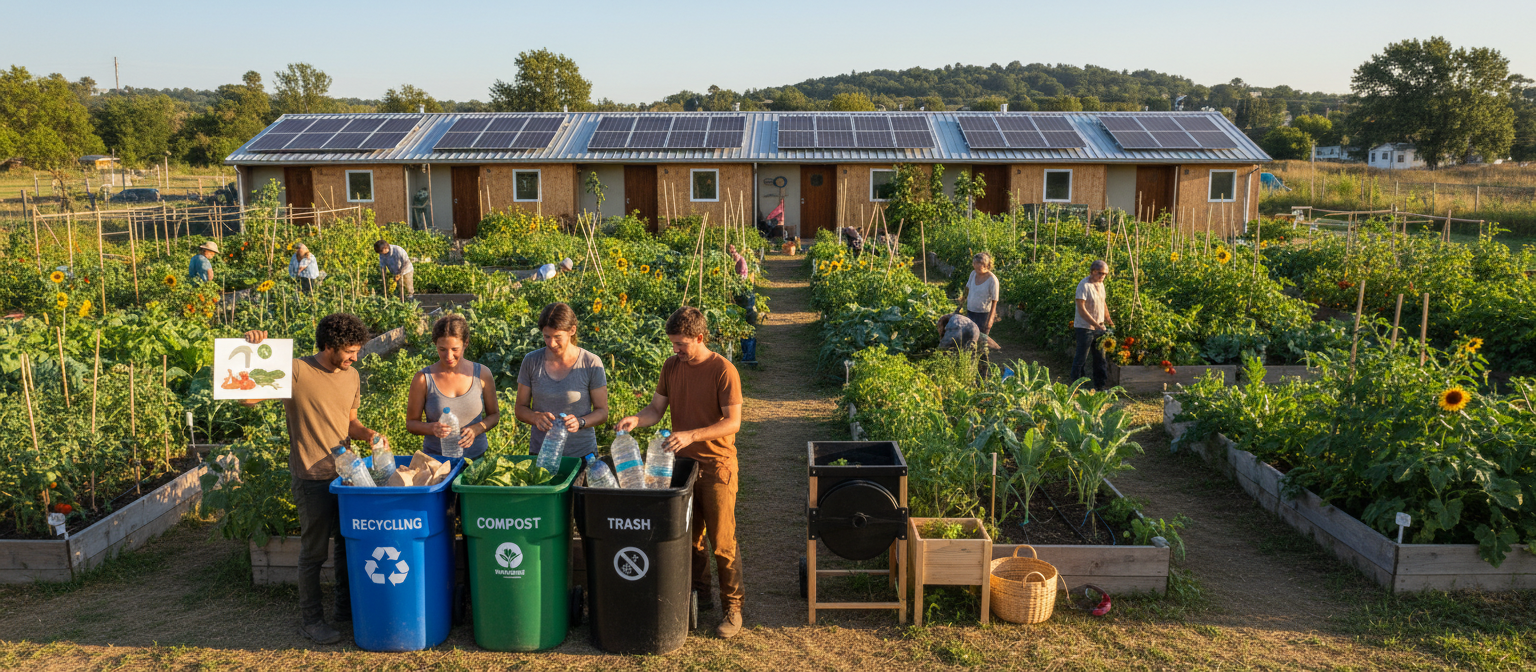
London has adopted several strategies aimed at reducing waste and increasing recycling.
The Circular Economy Approach
The Mayor’s Circular Economy Route Map promotes reducing consumption, reusing materials, and keeping resources in circulation for longer. This approach moves away from the traditional “take, make, dispose” model.
Local Support and Programmes
Organisations such as Resource London (https://resourcelondon.org) provide borough-level guidance and practical support. These programmes help councils and residents improve recycling performance while adapting solutions to local needs.
Postcode-Specific Challenges
Despite progress, several barriers continue to affect waste outcomes in different areas.
Recycling Confusion and Contamination
Inconsistent recycling rules between boroughs cause confusion. Items accepted in one postcode may be rejected in another, leading to contamination and rejected loads.
Space and Infrastructure Constraints
High-density housing often lacks adequate space for separate bins. Rubbish chutes rarely support recycling, pushing residents toward general waste disposal instead.
Learning from High-Performing Postcodes
Some boroughs demonstrate that improvement is possible with the right mix of policy, infrastructure, and engagement.
Localised Regulation
Clear, consistent guidelines and frequent collections encourage better recycling habits. Tailored solutions work better than city-wide rules applied uniformly.
Community Engagement
Neighbourhoods with active community involvement consistently perform better. Local campaigns, clear signage, and resident feedback all play a role in improving outcomes.
Technology and the Future of Waste Management
Advances in technology are transforming how waste is processed across London.
Smarter Recycling Systems
Modern sorting facilities use optical scanners and AI-powered systems to separate materials more accurately. This allows recyclables to be recovered from streams once considered unusable.
Efficient Collection and Processing
Smart bins and route-optimisation software reduce collection costs and emissions. Energy-from-waste facilities generate electricity while minimising landfill use.
Investment in underperforming postcodes could significantly narrow existing gaps.
Looking Ahead: Future Trends and Sustainability Goals
London faces a critical period as population growth increases waste volumes. Food waste alone exceeds 1.5 million tonnes annually, contributing significantly to greenhouse gas emissions.
Ambitious targets aim to:
- Reduce food waste by 50% per person by 2030
- Achieve a 50% recycling rate by 2025
- Reach 65% recycling by 2030
Meeting these goals will require cooperation between residents, businesses, and councils.
Conclusion
London postcode waste differences reveal how deeply local factors shape environmental outcomes. Housing density, commercial activity, infrastructure quality, and recycling access all influence how much waste an area produces.
By focusing on targeted, local solutions and improving resident engagement, London can reduce waste inequalities between postcodes. Understanding these differences is the first step toward a cleaner, more sustainable city.